Introduction for navigation bar
Navigation bar is on the left, including pages for home index, gene panel, MIRS score, calculation and prediction, more details about MIRS, and history about this web server.
Home page: This page is about the abstract for this study. The screenshots embedded summarize the detailed workflow of our study.
Gene panel page: This page is about how to identify the 12-gene panel. The screenshots embedded show the detailed steps.
MIRS score page: This page is about the MIRS score system that built through neuron network model. The screenshots embedded show the model summary and estimation.
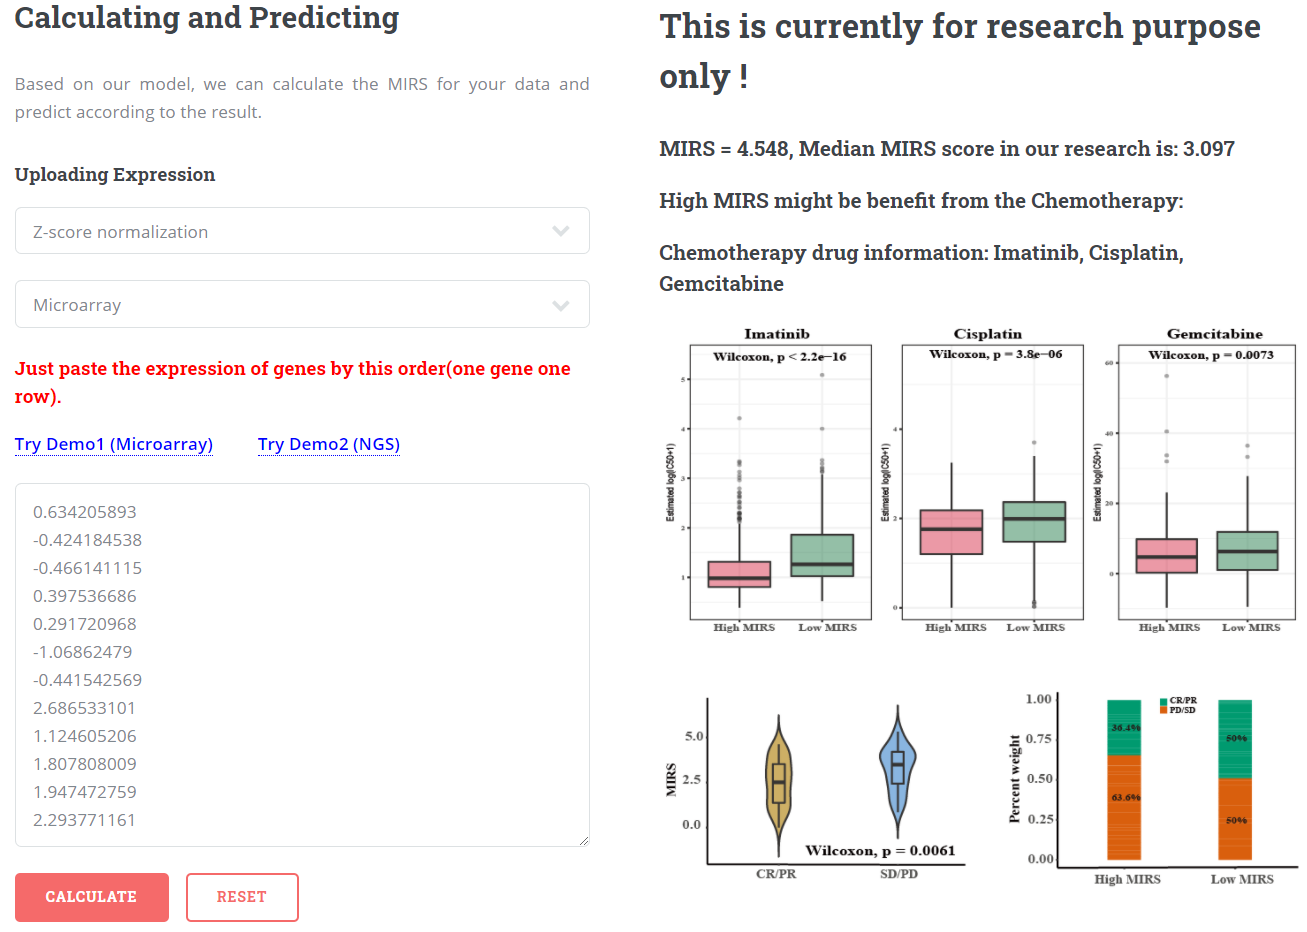
Calculation page: This page is a web tool supporting users to analyze your data. And after calculating the MIRS score of your data, we will give prediction about therapy based on the result.
More details about MIRS pages including therapeutic benefits page: and comparison with previous model: You can find more particular content about the therapeutic benefits estimated by MIRS score, and the superiority of MIRS score system after comparing with current prognostic models.
History about this web server: Simple information about the release of this web server.
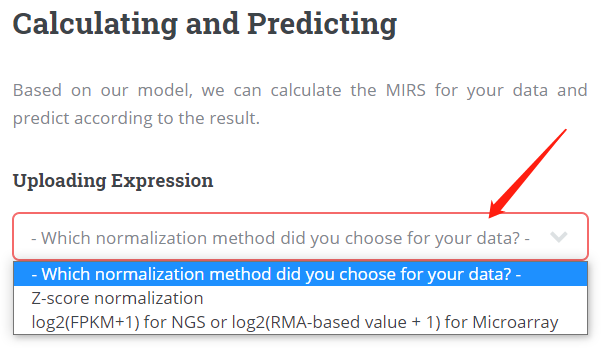 Comments: if your want to upload the normalized data, we only support z-score normalization since we used it during the construction of our MIRS score system. The formula of z-score transformation is: ( x - μ )/σ, x represents the raw expression of one gene, μ represents the mean expression of one gene, σ represents the standard deviation of raw expression of one gene. If your data is raw expression, then you can select "No (only raw expression)" as the state of your data, and z-score normalization will be performed after uploading your data.
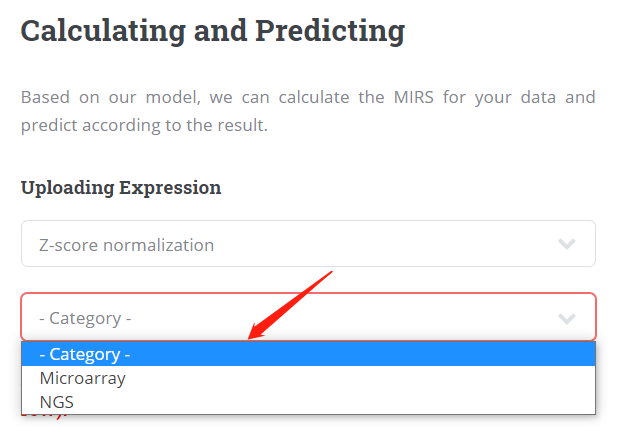 Comments: there are two data platforms are supported, including Microarray data and NGS data (next generation sequence). For Microarray data, the raw expression means the value after general Microarray data processing, such as background correction, normalization and summarization for probe-level data. For NGS data, raw expression means the value of reads count extracted by quantification softwares, such as stringTie, htseq and so on.
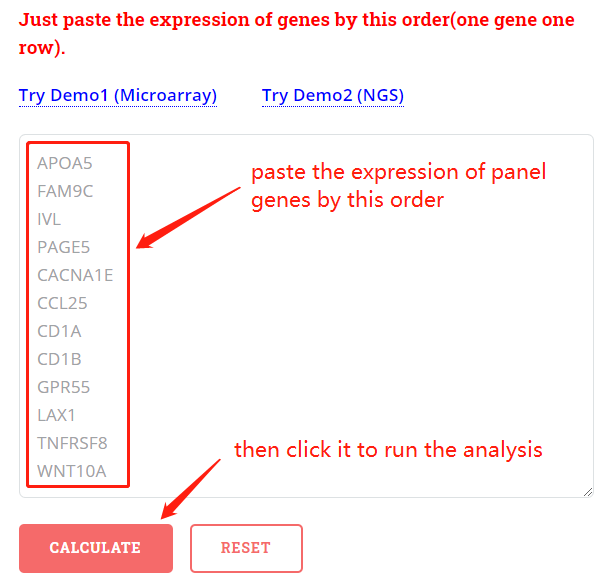 Comments: it is necessary that you need to paste the expression of 12 genes by the given order. we will calculate MIRS score according to the expression of genes and the weight coefficient accordingly.
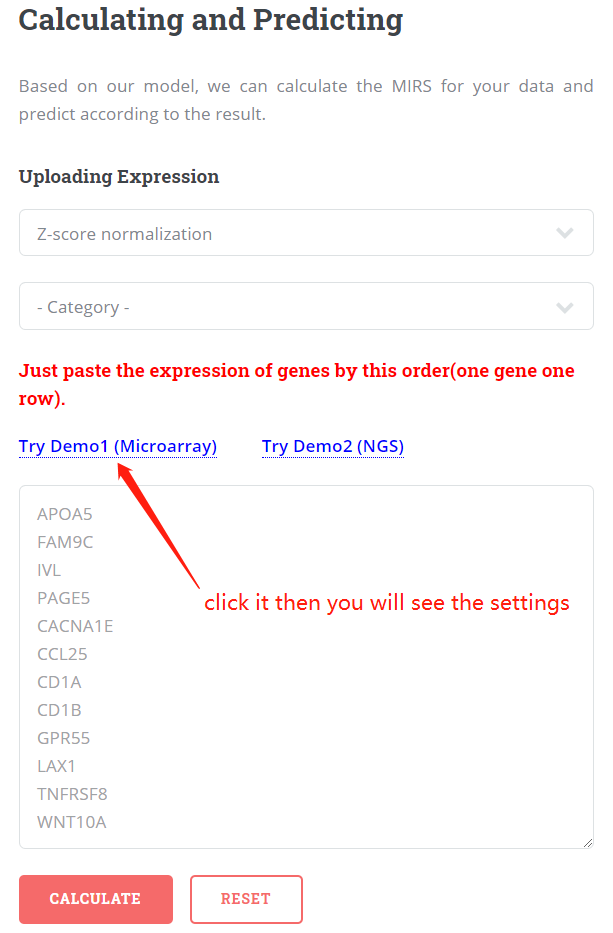
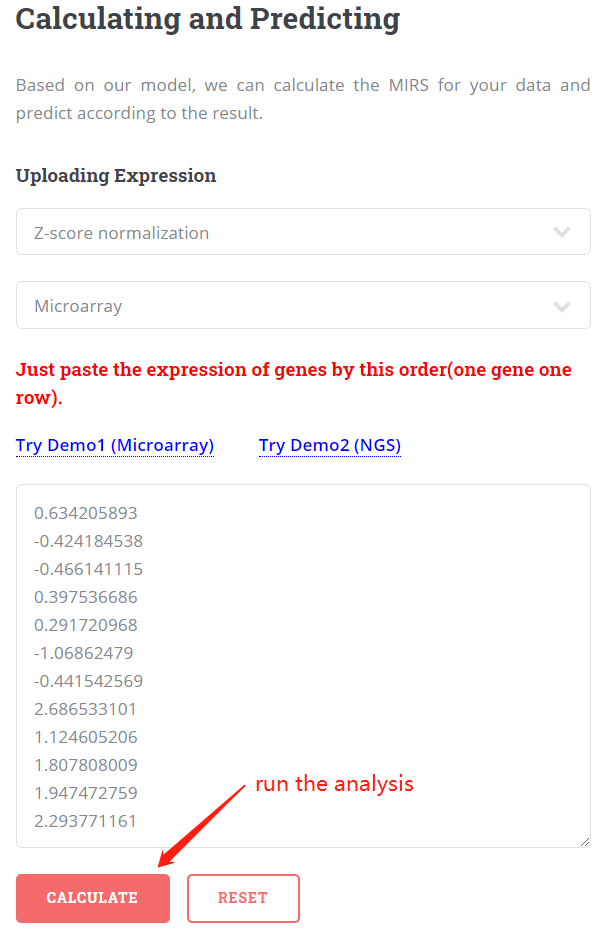
 Comments: the data of demo1 comes from one sample of Microarray data in our research.
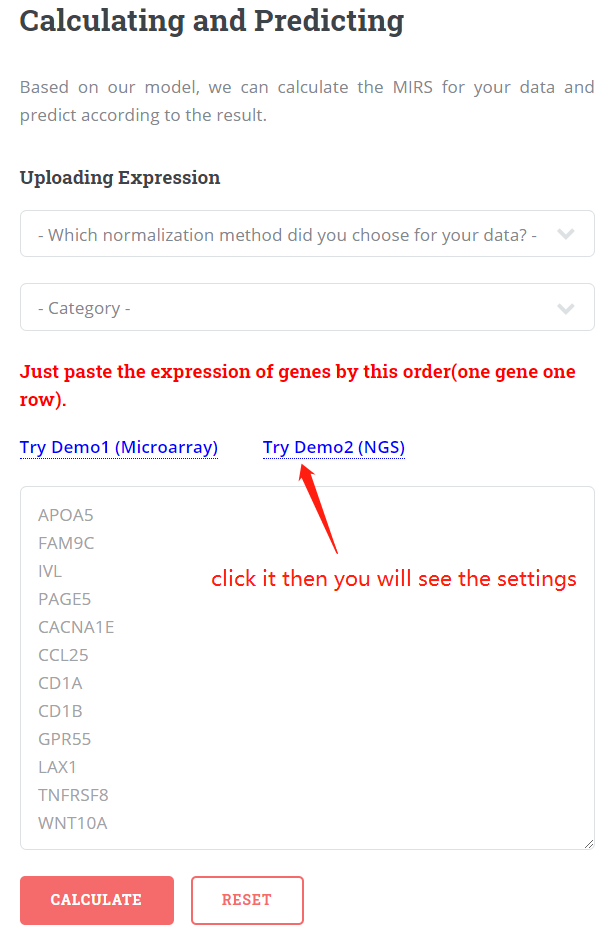
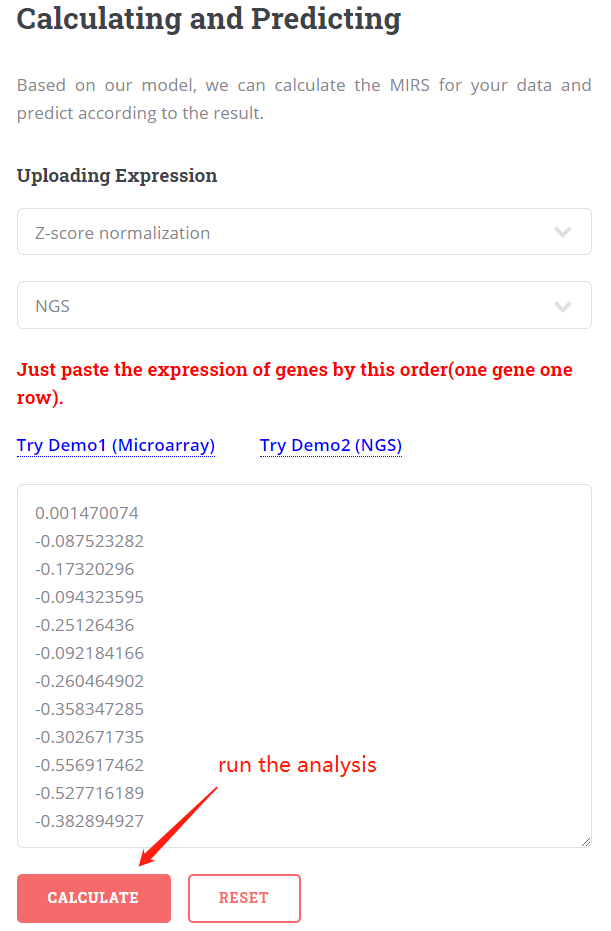
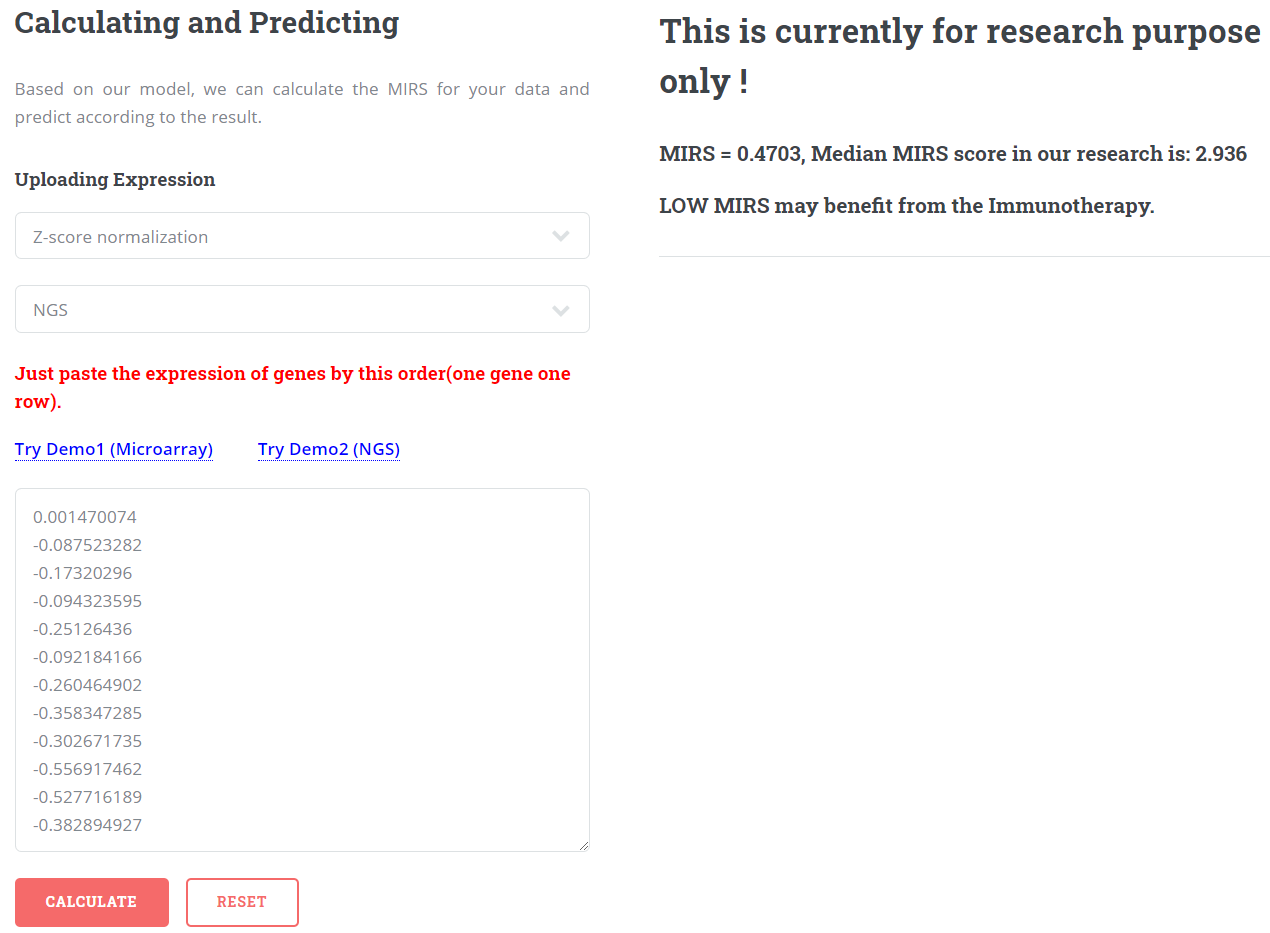 Comments: the data of demo2 comes from one sample of NGS data in our research.