Data Summary

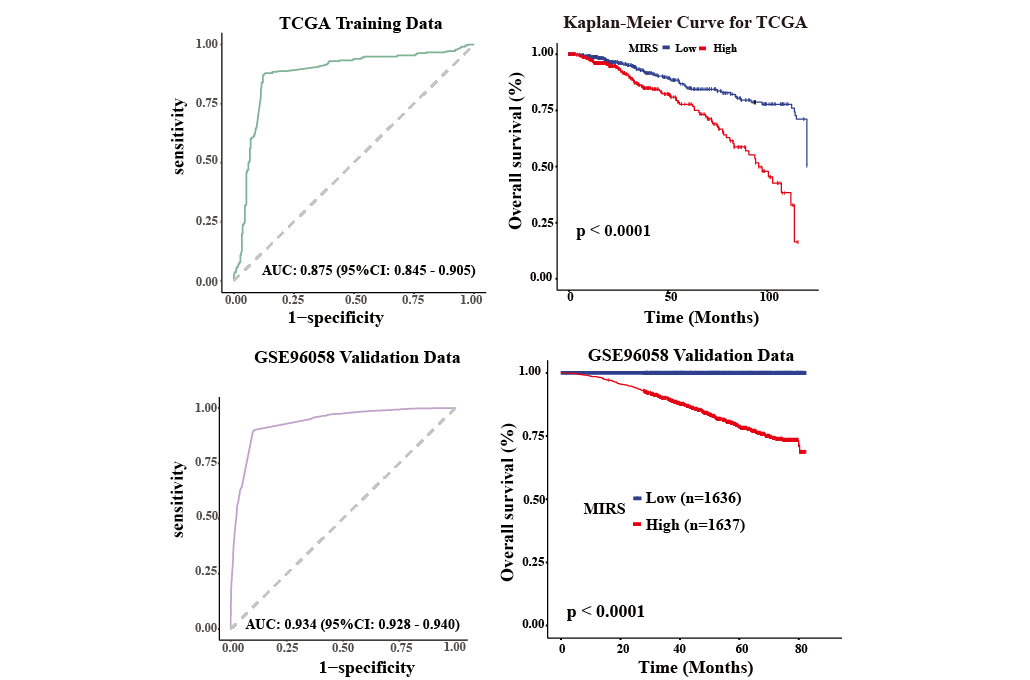
Description Category Sample Size MIRS Median
Breast Cancer cohort from TCGA NGS 1100 3.530
Breast Cancer cohort from GSE86166 Microarray 366 3.058
Breast Cancer cohort from GSE96058 NGS 3273 3.502

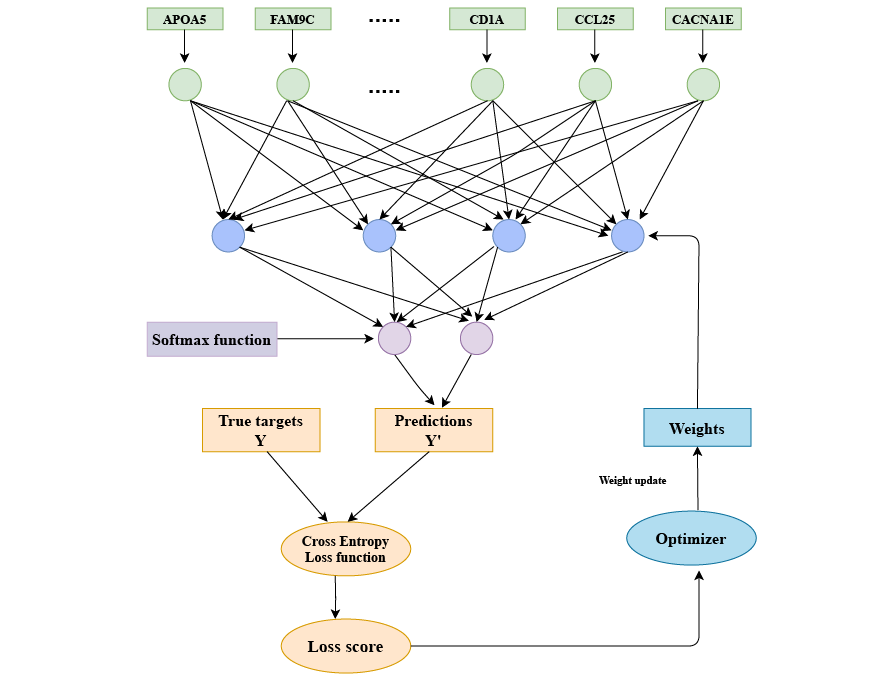
The 12 prognostic genes for calculating the risk score in TCGA data

Gene Name Category Gene expression (high) Gene expression (low) Weight
APOA5 Dangerous 1 0 0.369
FAM9C Dangerous 1 0 0.340
IVL Dangerous 1 0 0.888
PAGE5 Dangerous 1 0 0.237
CACNA1E Protective 0 1 0.580
CCL25 Protective 0 1 0.060
CD1A Protective 0 1 0.656
CD1B Protective 0 1 0.358
GPR55 Protective 0 1 0.715
LAX1 Protective 0 1 0.561
TNFRSF8 Protective 0 1 0.477
WNT10A Protective 0 1 0.743